The NHL is always chasing goals. Sometimes to its detriment, as the league often confuses goals with action. What the league really wants is to assign the Dead Puck Era to the land of wind and ghosts forever, which it pretty much has. It wants a fast game showing off the skills of players and not the ability of some plug to simply waterski behind all those that are better and faster than him, which it pretty much has. There’s little question the league has more skill in it than ever, which is just the evolution of any sport. Your favorite player from 1992 would almost certainly have their heart explode after a couple shifts in today’s game (Pavel Bure could keep up, though).
Through that, scoring has been up for a few years now, though a touch down from last year. Teams are averaging 3.10 goals this year, as opposed to 3.18 last year, but that’s still a 13 percent increase from 10 years ago (2.74 goals per game per team). Over at The Athletic on Tuesday, Murat Ates and Fluto Shinzawa try to get to the heart of why scoring is up and save percentages are down in the past decade.They do so through the eyes of a couple goalies, centered on the Jets’ Connor Hellebuyck, one of the leading contenders for this year’s Vezina Trophy (best goalie).
A few factors are mentioned, and they all play a part. Certainly the crackdown on goalie equipment has played a huge role, as netminders aren’t coming out to the ice looking like the Stay Puft Marshmallow Man anymore. There are just more holes to be found on them. Analytics is another, as teams know where the best chances are produced from and are focusing their play on getting to those spots and creating those chances.
Another is the increase in individual skill on every team. Teams now don’t necessarily have two scoring lines, a checking line, and then a palooka-filled fourth line that coaches and fans alike cover their eyes and hide behind chairs when they take the ice. This is probably a trend that should have happened a while ago, as there was always an advantage to be gained by trying to ice third and fourth lines that had a speed and skill advantage over teams still clinging to the idea that a fourth line could only be an “energy line” (*cough*Lou Lamiorello *cough*). The salary cap has made that tricky to pull off, but with more and more kids coming through the draft who are simply better prepared to play a faster and more skilled game, we’re getting there.
But by how much? This is what piqued my curiosity. So we’re gonna get chart-y. It is an admittedly crude method, but I took the forward analytic data from the past 10 seasons (throwing out the season in a silent can of 2020-2021) from NaturalStatTrick.com and then cut off the top quarter in average ice-time per game, essentially the top lines of every team. Again, not perfect, but the best I could come up with (man, do I wish I paid attention in those math classes instead of prepping for a stand-up career that would only yield tepid results, at best). And then I cut off the top half of forwards in ice-time per game, trying to focus on only the bottom six forwards in the league.
To try to cut out what effect shrinking goalie pads have had over the past 10 years, it’s best to look at individual expected goals per 60. That stat only has to do with where the shots are coming from, not whether they’re saved. Were forwards below the top line producing more and better chances over the past 10 seasons?
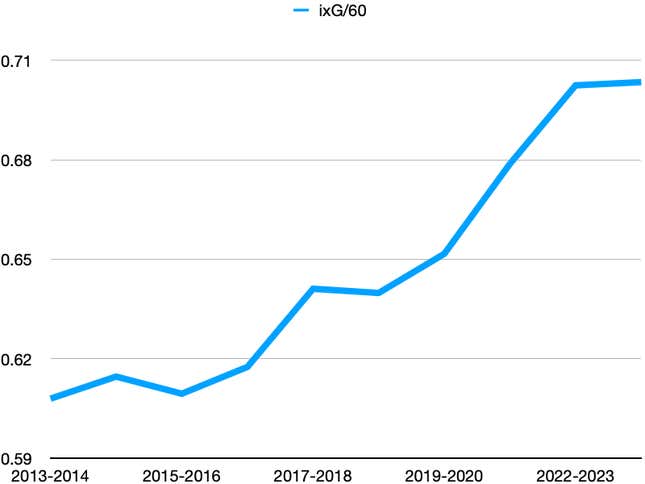
Well, here’s how it looks for forwards on the 2nd-4th lines:

That’s a pretty steady incline for players not averaging the most time on ice. It’s a 15 percent increase from what those forwards averaged in terms of ixG/60 in 13/14 (.609) to this season (.703).
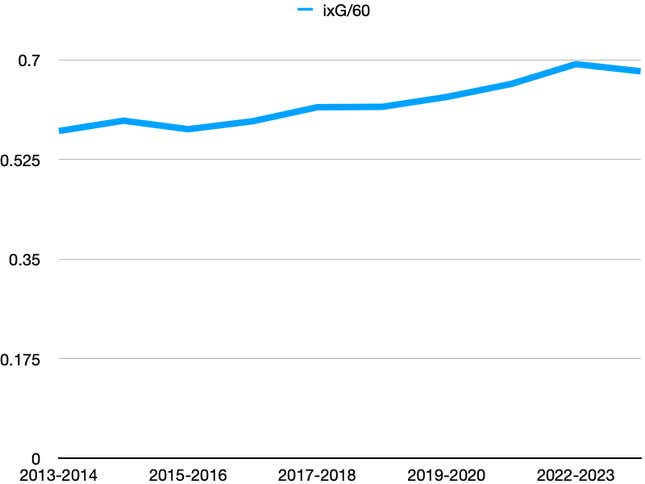
What about just the bottom six?

My chart skills aren’t what they should be, so while that looks like less of an increase, it actually isn’t. 10 years ago, forwards averaging the bottom half of ice time put up 0.575 ixG/60. This year it’s 0.68, which is an 18.2 percent increase from 10 years ago.
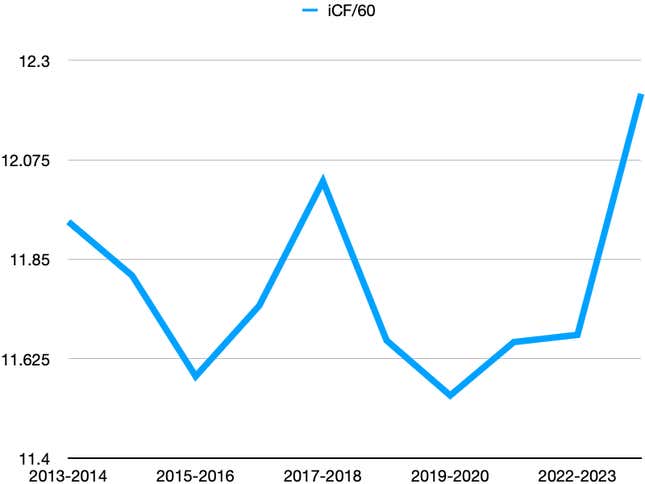
As far as straight attempts, which also wouldn’t be affected by goalie pads, there’s a little more volatility in those, but still the same kind of increase. As the Athletic article points out, teams aren’t as focused on volume of attempts and shots these days as they were 10 years ago when every team wanted to be the Kings and dump the puck in, win it back, get it to the points and bomb away to create a ruckus around the crease (or basically what the Hurricanes still do). Here’s the individual Corsi for lines 2-4:

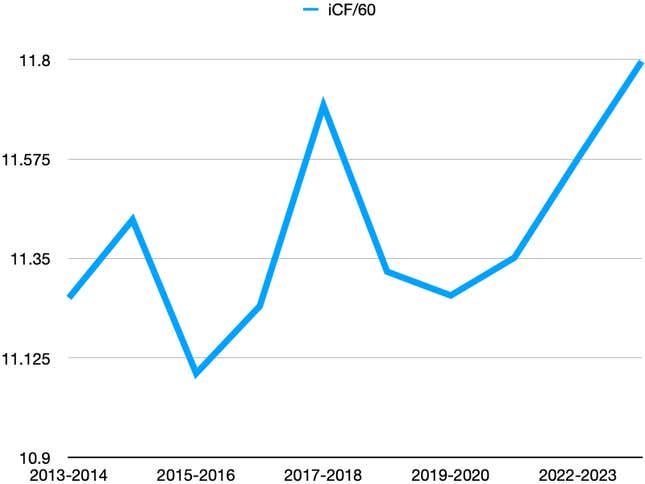
And then just bottom sixers:

More of a steady rise from the last group there, with a spike from the first group this season. But we can see that teams on all their lines are concentrating on better chances even while getting an increase in attempts.
While some fans may bemoan the loss of the grind/sandpaper/FAAAAAART sections of their roster, as more third and fourth liners are skilled players now, what they actually are is just able to do everything. Maybe they don’t hit as much, but that doesn’t mean they can’t get down in the corners and win the puck back, which is at the heart of hitting and checking, and got a little lost. And faster players are harder to hit, obviously.
It’s good for the league that more players can do more things, and that the skill level is rising throughout the league. And don’t worry, those who still cling to their Chris Draper dolls will soon be dead anyway.
Source link
#causing #increase #scoring #NHL